Fichièr:EfieldTwoOppositePointCharges.svg

Talha d'aquesta previsualizacion PNG per aquest fichièr SVG: 619 × 438 pixèls. Autras resolucions : 320 × 226 pixèls | 640 × 453 pixèls | 1 024 × 725 pixèls | 1 280 × 906 pixèls | 2 560 × 1 811 pixèls.
Fichièr d'origina (Fichièr SVG, resolucion de 619 × 438 pixèls, talha : 187 Ko)
| Aqueste fichièr proven de Wikimedia Commons?. Las informacions que lo concernisson son afichadas çaijós (procedura). |
Descripcion
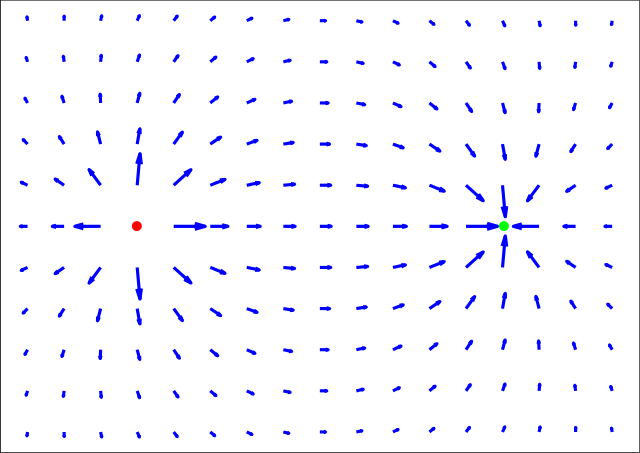
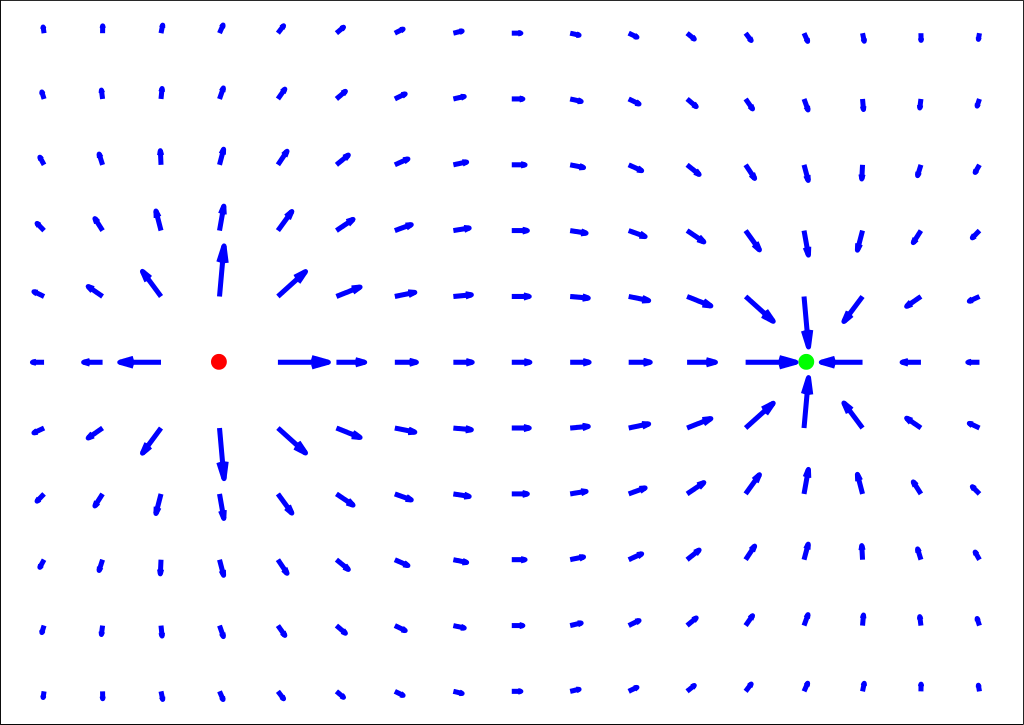
| Descripcion | Illustration of the electric vectorfield surrounding two opposite point charges. Red is positive, green is negative. |
| Data | |
| Font | Own work. Vectorfield plotted in Matlab using the 'quiver' function. Exported in Encapsulated Postscript (EPS) format; converted to Scalable Vector Graphics (SVG) format in GSView using 'plot-svg' via GNU libplot. Added circle drawings in Inkscape (GNU General Public License). |
| Autor | Mfrosz |
| Permission (Reütilizacion d'aqueste fichièr) |
Free for use by anyone for anything, but please give credit to Wikimedia or Wikipedia. |
| SVG information | Aqueste imatge vectorial es estat creat amb MATLAB |
Publicat jos licéncia(s)
| Jo, el titular del copyright d'aquesta obra, l'allibero al domini públic. Això s'aplica a tot el món. En alguns països això pot no ser legalment possible, en tal cas: Jo faig concessió a tothom del dret d'usar aquesta obra per a qualsevol propòsit, sense cap condició llevat d'aquelles requerides per la llei. |
Istoric del fichièr
Clicar sus una data e una ora per veire lo fichièr tal coma èra a aqueste moment
| Data e ora | Miniatura | Dimensions | Utilizaire | Comentari | |
|---|---|---|---|---|---|
| actual | 12 agost de 2006 a 10.41 | | 619×438 (187 Ko) | Mfrosz | {{Information |Description=Illustration of the electric vectorfield surrounding two opposite point charges. Red is positive, green is negative. |Source=Own work. Vectorfield plotted in Matlab using the 'quiver' function. Exported in Encapsulated Postscrip |
Paginas que contenon lo fichièr
La pagina çaijós compòrta aqueste imatge :
Usatge global del fichièr
Los autres wikis seguents utilizan aqueste imatge :
- Utilizacion sus am.wikipedia.org
- Utilizacion sus ar.wikipedia.org
- Utilizacion sus bg.wikipedia.org
- Utilizacion sus ca.wikipedia.org
- Utilizacion sus cs.wikibooks.org
- Utilizacion sus de.wikipedia.org
- Utilizacion sus en.wikipedia.org
- Utilizacion sus en.wikibooks.org
- Utilizacion sus en.wiktionary.org
- Utilizacion sus et.wikipedia.org
- Utilizacion sus fa.wikipedia.org
- Utilizacion sus fr.wikipedia.org
- Utilizacion sus gor.wikipedia.org
- Utilizacion sus he.wikipedia.org
- Utilizacion sus he.wiktionary.org
- Utilizacion sus hr.wikipedia.org
- Utilizacion sus hu.wikipedia.org
- Utilizacion sus id.wikipedia.org
- Utilizacion sus is.wikipedia.org
- Utilizacion sus mn.wikipedia.org
- Utilizacion sus nl.wikipedia.org
- Utilizacion sus no.wikipedia.org
- Utilizacion sus pl.wikipedia.org
- Utilizacion sus ro.wikipedia.org
- Utilizacion sus sh.wikipedia.org
- Utilizacion sus sl.wikipedia.org
- Utilizacion sus sr.wikipedia.org
- Utilizacion sus sv.wikipedia.org